

 LinkedIn

A founder sees his brand second in a ChatGPT shortlist on Tuesday. On Wednesday, he asks the same question and the brand is gone. He changed nothing. What broke?
Probably nothing. An AI visibility number is a sample, not a ranking. One answer tells you what appeared on one run, not where your brand permanently sits. I used to make the same point about ad tests: one click tells you nothing, ten clicks tell you a little, and a larger sample starts to tell you where to put money. AI answers need the same patience. Once you understand why they move, a screenshot stops looking like a verdict.
First principle: an answer is generated, not retrieved whole
Everything else follows from one fact: a language model does not pull a finished answer from a shelf. Given a prompt, it scores likely next tokens and generates an answer from those probabilities. The same words going in can produce different words coming out. Researchers who sent the same prompt 1,000 times at temperature zero still got 80 different completions. Server batching adds variation even when the sampling setting is meant to reduce it. Temperature zero turns down the wobble; it does not abolish it.
Take a running example: you sell a CRM, and the buyer prompt is best CRM for a 10-person agency. Run it ten times in fresh sessions. Your CRM might appear in six answers, a competitor in seven, and a third product in four. Those counts can overlap because an answer can name more than one product. None of the ten answers is the answer. Together, they give you an early estimate of how often each product appears.
That is also where the ad-test analogy has a limit. An ad impression is an opportunity you bought; an AI answer is a generated response shaped by more than your prompt. You can borrow the discipline of repeated observations without pretending the two systems work identically. One screenshot shows one run. Keep that distinction in place before looking for a cause.
Next layer: retrieval changes the candidate list
Generation explains why wording varies. On prompts that trigger live search, retrieval also changes what the model has to work with. It searches behind the question, reads the returned sources, then writes from that set. A source available at 9am may not be in the set at 5pm. An analysis of five stacked causes of ChatGPT variance puts retrieval beside sampling, memory, model version and phrasing. Fresh pages index, news cycles move, and competitors publish. Tuesday’s source list need not survive Thursday.
The source churn can be severe. A seven-day study of 530,875 citations found 79.2% day-over-day churn on ChatGPT, 88.3% on Gemini and 75.9% on AI Mode. Only 1.1% of the ChatGPT sources survived all seven days. If your CRM disappears from an answer, that does not by itself mean your site lost ground. The model may have drawn from a different pool.
Each engine has its own pool, too. Semrush counted around 15 sources per ChatGPT response versus around 3 for Gemini, with almost no brand overlap. AI Overviews add location, history and account signals through Google search. The same query twice in an afternoon can yield different summaries and sources. That is why practitioners tracking Overviews recommend weekly logged-out checks of 20 to 30 queries over about eight weeks before calling a movement a trend.
For our CRM prompt, a ChatGPT mention and a Gemini mention are observations from different systems, not two slots on one league table. Keep their results separate. Otherwise, a change in the mix of engines you check can look like a change in your visibility.
Hold the test steady before you count anything
Now that the answer and its sources can vary, the next job is to stop changing the parts you control. Six different words can make a different test. In a Peec AI set of 37,804 responses, keyword-style phrasing scored up to 25% higher visibility than conversational phrasing. Another comparison found different mention rates for recommendation and research prompts, though those figures also came from different engines. I would not credit that whole gap to wording alone.
I keep a frozen prompt sheet for this reason. best CRM for a 10-person agency stays letter for letter on each run. what CRM should my agency use may sound equivalent to a person, but it is a different input to the model. Both prompts may be worth tracking. Just do not swap one for the other halfway through a series and call the result growth.
Then record the variables you cannot fully control: logged-in versus logged-out access, memory versus a fresh session, location, engine, model version and date. A variance study found brand itself explained 1.5% of variance, resampling the same prompt explained 34.8%, and query language explained 26.5%. Those figures are a useful warning against reading too much into a single check.
If you check from your usual account with history on, you are measuring that setup, not a general market position. Run fresh, isolated sessions where you can; freeze the wording; and label what you cannot hold fixed. The principle is the same one I used in ad tests: if the setup changes while you measure the result, you will struggle to say what moved.
Turn answers into rates, not ranks
Once the prompt and setup are consistent, you can count. Mention rate is a batting average, not a position. Run the frozen CRM prompt 100 times on one engine and count the answers that name your product. If 60 do, that is a 60% mention rate. It does not mean you rank sixth out of ten or occupy a permanent place in a list. It means the product appeared in 60 of those 100 sampled answers.
The other measures answer different questions:
- Share of voice: your mentions divided by all brand mentions across the prompt set, multiplied by 100. If your CRM has 24 mentions out of 100 total brand mentions, its share is 24%. Count every brand the model names, not just the competitors you put in a dashboard.
- Presence rate: how broadly you appear across the prompts you track, without treating every appearance as a contest for the same share.
- Citation rate: how often an answer links to your site. A citation is not the same event as a mention in the answer text.
I go through the rate math in Your AI Visibility Score Is a Rate, Not a Rank. For this test, remember the shorter version: mention rate asks how often? Share of voice asks how often compared with the brands named alongside you?
Do not let a vendor fold mentions and citations into one tidy number. A model can link your CRM site without naming the product, or name the product without linking the site. In one engine study, Gemini named brands in 83.7% of answers but cited in 21.4%, while ChatGPT mentioned brands in 20.7% but cited in 87%. The study also found that 61.7% of citations never named the brand in the text. Count mentions and citations separately, per engine. A blended score hides the difference you need to diagnose.
Give the sample room to settle
A clean rate can still be a noisy rate. One analysis put the reliability of a single AI answer near 0.01: statistical noise wearing a chart. Repeating a prompt helps, though the same analysis found the added reliability per extra run dropped to 0.0003 past about five repeats. Breadth matters as well. Five runs across 60 buyer prompts show you more of the questions people ask than 30 runs of one prompt.
That does not mean quietly rewriting the CRM prompt every week. It means building a wider frozen set: the 10-person-agency question alongside other buyer questions you have decided to track, each repeated consistently. Repeats tell you how much a particular prompt wobbles. Breadth tells you whether the pattern extends beyond that prompt. You need both before you treat a movement as meaningful.
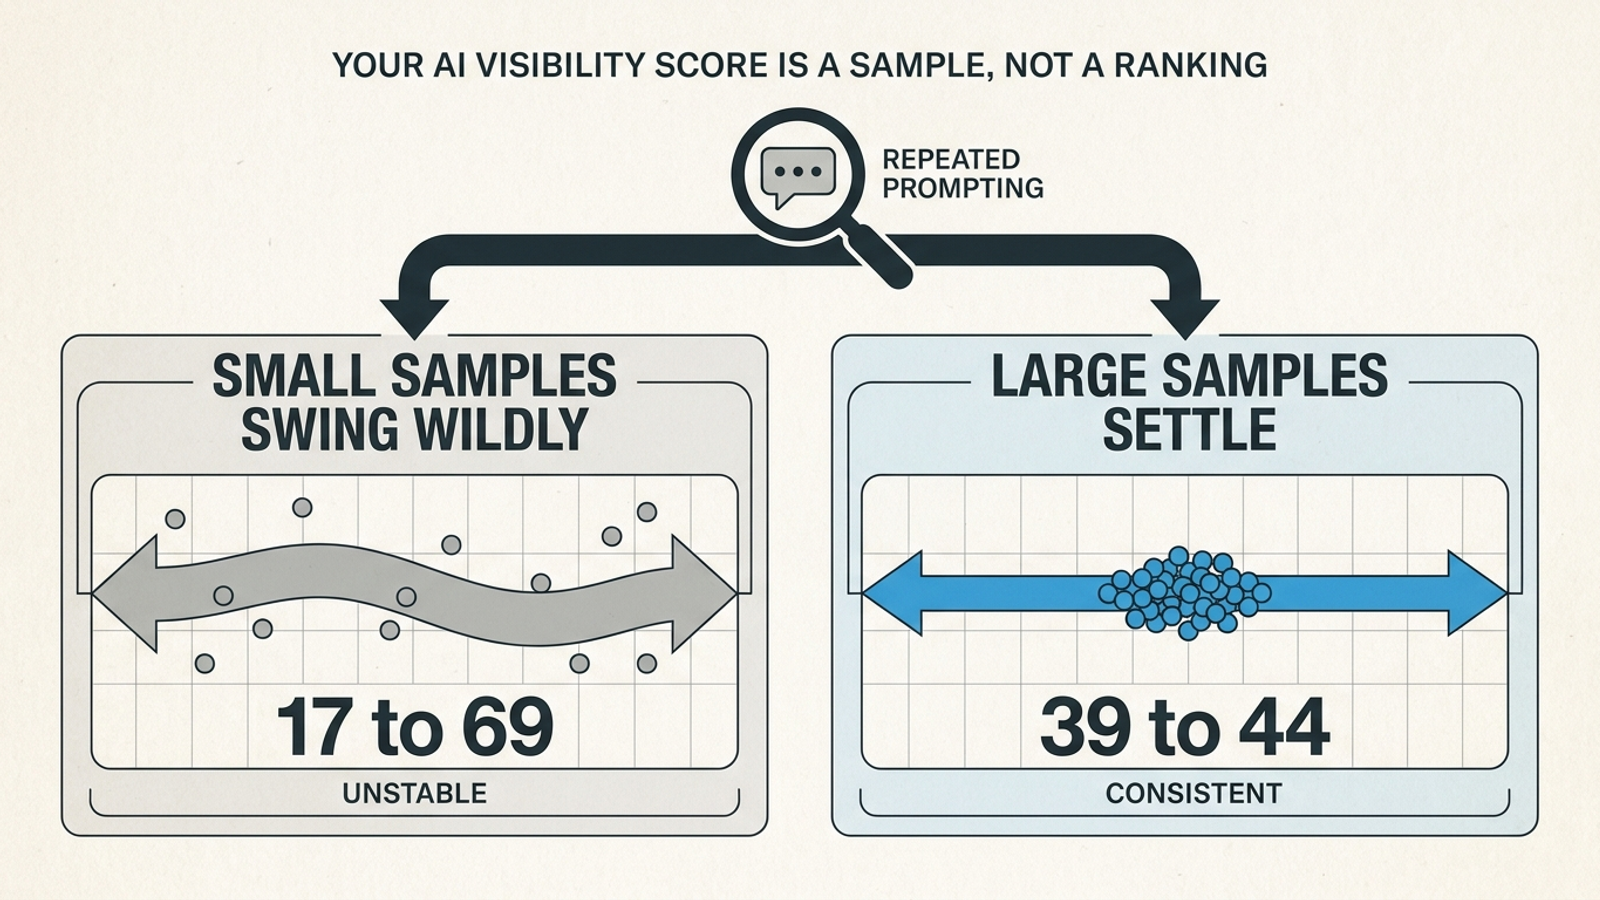
Here is what a thin sample can do to an honest number. In an example with a true 40% mention rate, measuring 10 prompts once produced weekly readings that swung 20 points or more in 49% of weeks, with readings from 17 to 69. With 100 prompts run five times each, the reading sat at 39 to 44. Same underlying visibility; very different reasons to panic.
Say you spend $20k a month on search and a vendor reports a jump from 32% to 47% after checking 12 prompts twice. I would not call that growth. I would ask how wide the likely range is, what last month’s baseline looked like, and whether the prompts and engines stayed the same. Wait until the ranges stop overlapping before you call the measured change real. Even then, a real change in the rate does not prove your page edit caused it. For that question, use a control-group test and keep pages you did not touch alongside the ones you changed.
Read the method before the vendor’s chart
Most AI visibility reports lead with a chart. I read the method first. Before I look at a number, I want four answers:
- How many runs were made per prompt, per engine?
- Are the engines reported separately?
- Did the prompt wording stay frozen between periods?
- What baseline, including control prompts, am I comparing against?
A workable setup uses 50 to 100 buyer-language prompts, frozen wording, 3 to 5 runs per prompt per engine in fresh isolated sessions, per-engine reporting and control prompts you do not intend to win. That is a measurement design, not a promise that every week will deliver a neat answer. The controls are especially useful: if the target prompts and controls rise together, suspect a broader shift before taking credit. If the targets rise while controls sit flat, your change is more interesting, though it still needs investigation.
I cover when that work is worth buying in Is AI Prompt Tracking Worth Paying For?. Sampling without someone prepared to act on a miss is just a more expensive screenshot.
A report that cannot answer those four questions is unreadable. Without runs per prompt, you cannot judge how noisy its rate is. With a blended cross-engine score, you cannot tell whether you need more mentions on one engine or more citations on another. What the deck calls coverage, I call doing the boring part twice: sample properly, then examine the page, entity detail or source the engine actually used. A vendor that sells only the first half leaves you refreshing an answer on Wednesday and wondering what broke.
Put the model to work on a new prompt
Say you run a plumbing company in Austin and want to know whether you appear for emergency plumber in Austin open now. The first-principles model gives you the order of operations. The answer can vary; retrieved sources can vary; your own setup can change the result. So freeze the wording, run it five times per engine in fresh logged-out sessions, record mentions separately for each engine, and repeat the checks weekly for eight weeks. Keep control prompts and a baseline from before any change you want to assess.
If your ChatGPT mention rate moves from 30% to 55% across the accumulated checks while controls sit flat, you have a change worth examining. Look at the ranges before calling the measured shift real, then inspect what changed in the sources or your pages before claiming credit. If every prompt, including the controls, jumps in the same week, do not put that chart in a case study. The engine may have shifted under you.
That is the method: repeated runs, a baseline and enough observations to see past the wobble. A single answer is entertainment. A sampled trend is measurement. I keep untouched pages as controls because without them I cannot tell my work from the weather.
I run this sampling for clients inside groas now. Checking 100 prompts five times across three engines every week is exactly the repetitive work I used to do at 1am, and exactly the work machines do better. The human part is deciding which prompts matter, what page change might earn the citation, and when the range says stop. Do that split and the screenshots stop scaring you.